ChatGPT Interface Gets Visual: What Founders Should Test
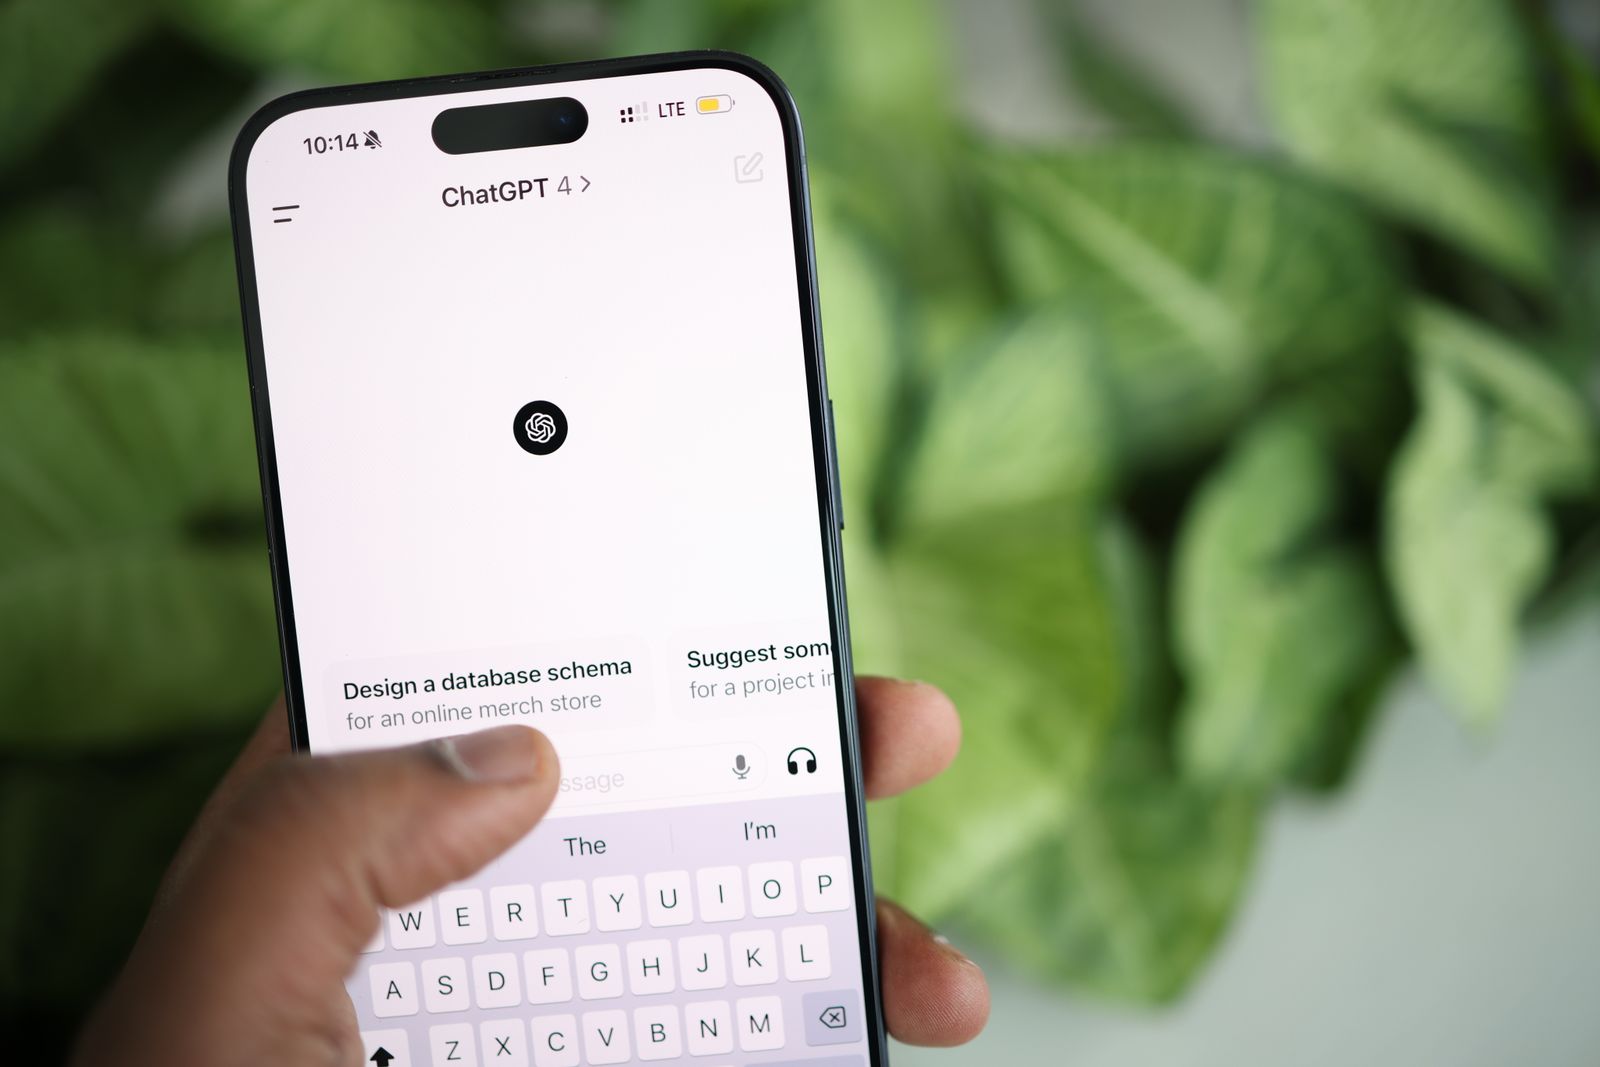
OpenAI is launching Intelligent UI, a feature that turns ChatGPT from a wall of text into a more visual, interactive interface, TechCrunch reported on October 7. Answers can now include diagrams, charts, maps and small calculators that users can tap, adjust and edit.
That matters because many founders already use chat as a daily work tool. When the same window can show a savings calculator or an editable graph, the line between asking a question and building a rough deliverable starts to blur. It follows a string of workplace additions, including the AI productivity tools OpenAI added earlier this fall.
What Intelligent UI Actually Changes
Until now, ChatGPT has been mostly text. OpenAI product manager Aarush Selvan acknowledged that in a briefing, and the company says the new design aims to make hard topics easier to learn. During the demo, one sample prompt asked how airplane wings generate lift, and the chatbot replied with a handful of diagrams.
Other demos covered a recipe layout, a diagram of how bike parts work, a route map for a long hike and a calculator for personal savings. Many of these elements respond to input, so users can move a slider or change a number and watch the result update. People who prefer fewer visuals can turn the amount down.
| Plan tier | Availability |
|---|---|
| Pro, Plus, Business, Enterprise | Global launch alongside GPT-6 |
| Free and budget Go tiers | Starting Thursday |
Why Founders Should Care About a Visual Chatbot
A lot of business thinking happens in rough models. Pricing math, runway estimates and funnel assumptions all live in spreadsheets that take time to build. If a chatbot can draft an interactive calculator in seconds, you can pressure-test an idea before you open a single file.
There is also a customer-facing angle. Your buyers will soon expect answers that show a chart, not a paragraph. Teams that sell software or services should ask how their own product explains itself, because the standard for clarity is moving.
Five-Minute Tests to Run This Week
Try the feature on real work, not demos. Ask it to build a break-even calculator with your actual price and cost, then compare the output against your spreadsheet. Next, request a customer journey diagram and see whether it matches how your buyers behave.
Keep a simple log of what saves time and what needs fixing. For example, note when a chart looks polished but hides a wrong assumption. If you run an online shop, see how this compares with design-by-chat tools such as the AI store builder inside Shopify.
Accuracy Risks Behind the Pretty Charts
A clean visual feels authoritative, and that is exactly the risk. A well-formatted chart can carry a wrong number, and a reader is less likely to question it. Treat every generated figure as a draft that needs a source and a second look.
Check the basics before you share anything with investors or clients. Confirm the inputs, recompute one result by hand and note which version of the tool produced the output. OpenAI describes its current plans and features on its official site, which is worth checking for what your tier includes.
What Comes Next for Chat Interfaces
Expect competitors to answer quickly. Voice, visuals and interactive elements are converging in one window, and tools such as the AI voice agents from ElevenLabs show how fast the spoken side is improving. The interface itself is becoming the product.
For a small company, the move is to stay curious without rebuilding your workflow every month. Pick one recurring task, such as weekly reporting, and test whether visuals make it faster. Keep what works, drop what does not, and revisit in a quarter.
How to Brief Your Team on the New Features
New tools only help when people actually use them well. Hold a short session where each person shares one task they handed to the chatbot this week and what came back. Those examples teach more than any announcement.
Create a simple rule for sharing outputs, too. For instance, anything sent to a client should be reviewed by a human who can explain how the numbers were built. As a result, the team gets speed without giving up accountability, and you avoid awkward corrections later.
Lastly, set a budget of time, not just money. Give the experiment two weeks and a clear goal, such as cutting report prep by an hour. If the goal is missed, you have lost little, and if it is met, you have a repeatable win.
One more tip: save the prompts that produce useful visuals in a shared document. Over time, that library becomes a small asset for your company, and new hires can use it to get up to speed without starting from scratch.
Quick Answers About ChatGPT’s New Look
Who gets the new interface first?
Paid tiers get it as GPT-6 rolls out, and free and Go users follow on Thursday.
Can I turn the visuals down?
Yes. Users can reduce how many visuals appear in responses.